Bee++
2019-02-01There is currently an epidemic of dying bee hives. Colony Collapse Disorder, where the majority of a hive’s worker drones disappear suddenly, has doubled in prevalence since 2007. These bees are vital for a vast portion of our agriculture. Without them our crops would remain unpollinated and not produce the food and other products we need to survive. In order to combat this issue, I developed a sensor to monitor the traffic through a beehive’s entrance.
This sensor measures capacitance to detect when bees travel through the hive entrance, and also provides information about their size and speed. The sensor sends its detections over WiFi to a dashboard server in the cloud for easy analysis by the hive’s keeper. If the bee keeper notices an anomaly in the hive’s activity, such as lower traffic volume or the bees moving slower than usual, they can intervene before further damage is done to the hive. In the future, this information could be analyzed automatically to send alerts for anomalous behavior.
The Sensor🔗
Why Capacitance?🔗
There are a variety of methods that could be used for this task. Others have used infrared LEDs and light sensors to detect when a bee blocks the light’s path1, and there have been several other projects that used capacitance2 3. Both strategies can measure traffic volumes and speed (by using a pair of sensors and measuring the time it takes the bee to travel between them). Capacitance offers a few advantages: it is very minimally invasive as it does not require direct contact, the sensor can be hidden outside the existing hive entrance, and it additionally allows the sensor to measure the size of the bees based on the magnitude of their capacitance as they pass by the sensor.
Capacitors, how do they work?🔗

Capacitors are an electrical component that functions as a kind of power storage in a circuit. Capacitors are composed of two parallel plates of metal, with some kind of non-conductive (dielectric) material between them. The overall capacitance of such a circuit is affected by the area of the plates, the distance between them, and the properties of the dielectric material. For the purposes of this sensor, the size and distance between the plates will be held constant. We can then detect a change in the material between the plates by measuring a change in the capacitance. Importantly, there can be a gap of air or other material between the plates and the material we wish to analyze, so the effect can be measured without physical contact between the bees and the metal plates.
The Sensor Circuit🔗
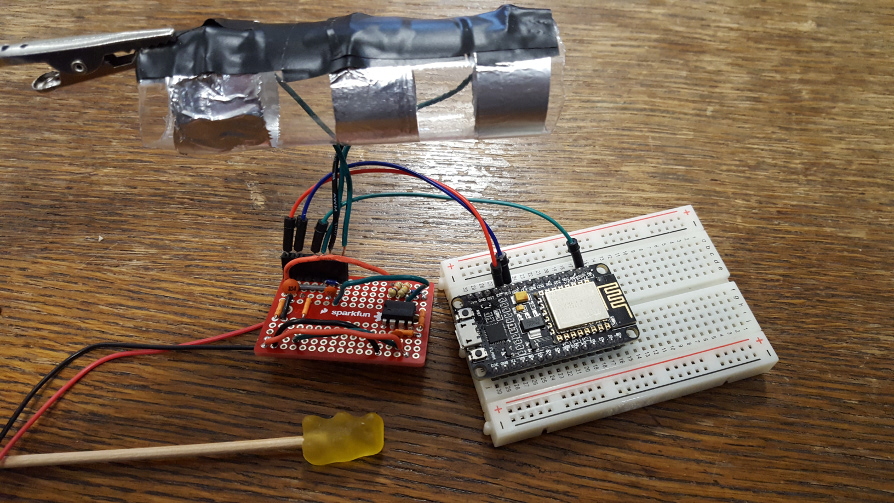
As a proxy for a hive entrance, I used a plastic tube of sprinkles with the ends cut off and the sprinkles removed. I wrapped three rings of aluminum foil around the tube at the ends and the center to create two physically large (but small in capacitance) capacitors with a shared ground on the center loop. The dielectric material is then the plastic tube itself, as well as the empty space inside the tube. When a bee or other object passes through the tube, the capacitance will change. One reference I used for this project measured the change in capacitance at about 0.5pF which is smaller than any widely available capacitor component, so this effect is extremely small. Rather than using an actual bee, I elected to use a yellow gummy bear on a stick due to the similar size and hopefully similar capacitance values due to water content.
Capacitance is generally measured through the time it takes for the capacitor to reach its maximum charge and match the voltage fed in to it. When a capacitor is connected to a voltage, its charge and the voltage across its terminals will follow an exponential decay curve toward the voltage on its positive terminal. The rate at which it charges is proportional to its capacitance. For extremely small capacitors, this is too fast to measure directly so other methods based on measuring the effects on waves passed through the capacitor (essentially charging and discharging it quickly) are used.
I used a circuit based around an NE555P chip which generates a square wave with a frequency that depends on the capacitance on one of the chip’s pins 4. The chip generates a square wave by enabling and disabling a signal as an internal capacitor charges and discharges. By attaching an additional external capacitor (in this case our sensors), we can change the rate at which the overall circuit charges and modify the resulting frequency. This frequency can then be measured in order to measure the capacitance across our sensors. Because the capacitance we are measuring is so small, the circuit required a significant amount of trial and error to reduce noise and increase its sensitivity. In particular I added a few capacitors across various pins until it worked. I also tried modifying the values of the resistors in the circuit which should have lowered the output frequency and made it easier to read, however none of the values I tried produced useful results.
For my application, the two capacitance sensors were connected together so that the measured capacitance is the sum of the capacitance over the two sensors. The area of highest sensitivity for each of the sensors is in the centerpoint between the center loop and either outer loop. So, when a bee passes through the tunnel the capacitance will spike as it passes through the first centerpoint, lower as it passes under the middle ring, then spike again as it passes through the second centerpoint. Since the values of the two sensors is summed, it is impossible to tell which one is triggered first. If the two sensors were read separately with separate circuits you could additionally detect whether a bee was entering or leaving the hive. However running two of the sensor circuits in parallel caused too much noise in the readings to be useful.
Signal Processing🔗
In order to measure the frequency coming from the sensor circuit, I needed to be able to sample an analog value very quickly. The waves coming out of the circuit need to be between about 10kHz and 100kHz for optimal accuracy, so the microcontroller needs to sample at about 200kHz (Nyquist frequency). The microcontroller I used (an ESP8266, on a NodeMCU development board) has a clock rate of 80MHz, and has an internal Analog-to-Digital converter (ADC) which can sample at about 1MHz using some low-level libraries, although I am not sure of the exact sampling rate. Getting clean and fast samples from the ADC was a significant problem for the whole duration of this project. It took a significant amount of optimization in both the sensor circuit and the code on the microprocessor in order to get a clean signal.
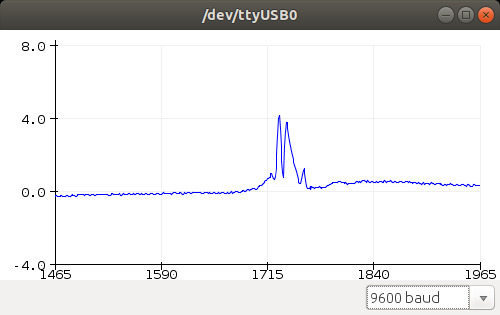
If I sample the incoming square wave over a fixed window of time and at a high enough sampling rate, I can count the pulses and get a measure of the frequency and therefore the capacitance of my sensors. I then sample the measured capacitance value at approximately 100Hz. When a bee crosses the centerpoint between two of the loops of foil, there will be a spike in the capacitance value. I can detect a spike by setting a threshold above the typical noisy fluctuations in the signal. I also compensate for varying ambient capacitance from the environment in the form of humidity and larger nearby objects by subtracting off a long-term exponential moving average of the capacitance signal. When I detect a pair of spikes as a bee pass through both of the capacitance sensors, I can derive the speed of the bee from the time difference between the spikes and the distance between the sensors’ centerpoints, and I can derive the size of the bee from the magnitude of the spikes in capacitance. After each detection I send the size and speed values over WiFi to a server in the cloud which additionally records the time the message arrived at the server and saves the detection to a database.
In summary, there are two levels of signal processing between the output of the sensor circuit and the final detections. First, the square wave from the sensor circuit is mapped to its frequency. Then that frequency is plotted over time and analyzed to produced the bee detections. Finally these detections are sent over WiFi to a central server in the cloud.
Dashboard🔗
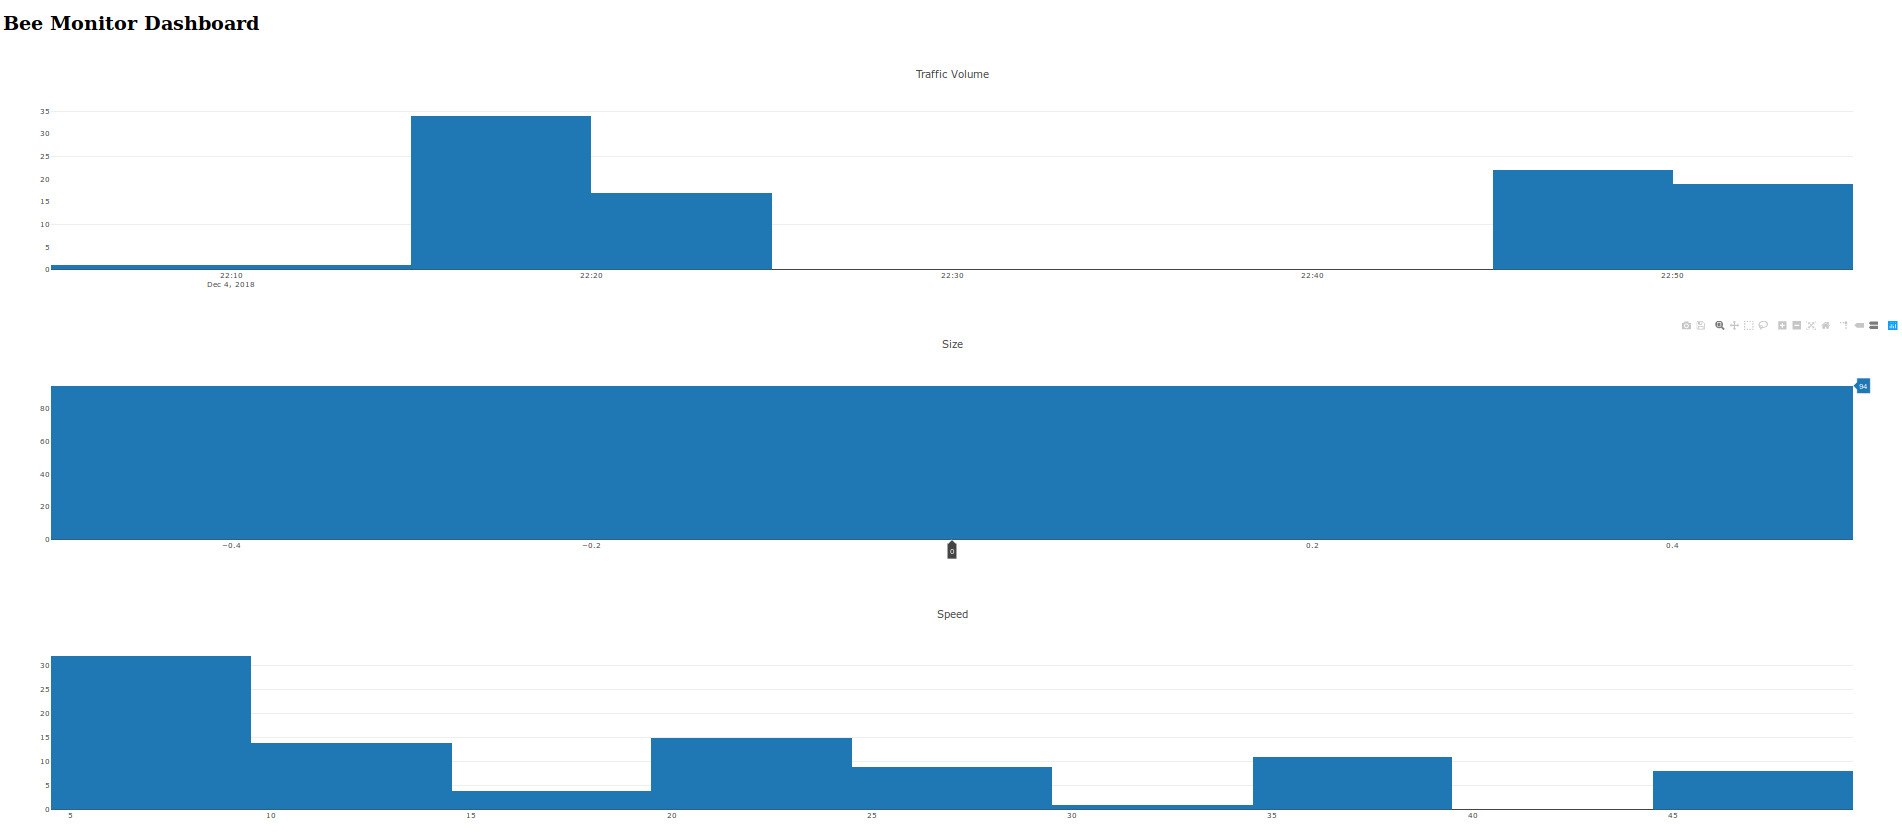
For my dashboard I used the Dash framework by Plotly. The server reads from the detection database and generates a table of the entries and several histograms of traffic volume, bee size, and bee speed. The charts and table update automatically to give a live feed of data from the sensor. The entire dashboard is implemented in about 50 lines of python code and can be hosted in the AWS cloud on a t2.micro instance.
All of the code is available at: https://github.com/HenryWConklin/beecounter